11+ Best Business Intelligence Tools of 2023 (Ultimate Guide)
Choosing the right business intelligence tools is vitally important to your business. From data analysis to performance monitoring, the best business intelligence tools can help you meet your goals. In this guide, I ranked and reviewed the 11+ best business intelligence tools, along with my top 5 choices, so that you can pick the best one for you.

Zoho
Zoho transforms data into insights that help businesses make informed decisions and optimize their operations.
Sisense
Sisense is a Business Intelligence Software & Analytics platform that helps you simplify complex data and create analytic apps.
Tableau
Tableau is a BI and Analytics software that helps you understand complex data while embedding data analytics with your products.
SAP Business Intelligence
SAP Business Intelligence offers a full business intelligence suite to help you with data visualization, data analysis, and reporting.
Looker
Looker is a BI tool that helps you analyze and share real-time analytics. It also combines all the data and provides an overview.
We’re reader-supported. When you buy through links on our site, we may earn an affiliate commission.
Today’s data-first companies need strong alignment between marketing, sales, and BI teams to push business results forward.
When it comes to data, there has to be a single source of truth.
According to Forbes, 54% of enterprises say cloud business intelligence (BI) is either critical or very important to their current and future strategies.
Business intelligence (BI) tools help businesses collect, monitor, analyze, and predict future business conditions by understanding all of the company’s complex big data in one place.
From useful data visualizations and real-time metrics to automated reports, database software and systems, and more, a company is only as strong as its BI team – and the software behind it.
Let’s get started.
What Are the Best BI Tools?
1. Zoho.
Best Overall Business Intelligence Tool.
Adam’s Take
Zoho provides a self-service BI and analytics platform that is easy to use. It provides users with various essential features (along with more advanced ones) related to business intelligence. From creating visualizations that can be easily shared with others, to uncovering hidden insights with the help of predictive analytics, Zoho provides everything one needs in a business intelligence tool.
Zoho connects to multiple sources that organizations use, including spreadsheets, SQL databases, cloud applications, and social media platforms.
This allows users to get a complete picture of their business by analyzing data from all these different sources in one place.
While the platform is easy to use, it still provides users with powerful features such as predictive analytics and the ability to create custom dashboards.
With a self-service data preparation and management module, Zoho makes it easy for users to clean and prepare data for analysis.
This is a crucial step in the business intelligence process as it ensures that data is high quality and ready for use.
Key Features:
- Catalog data to make it easy to find and use when needed
- Enrich data with external data sources to get a complete picture of your business
- Auto model to automatically build models based on your data
- Smart-Cleanse to clean and prepare data for analysis
- Data preparation & management to ensure that data is of high quality and ready for use
Pros:
- Unified business analytics allow users to connect to multiple data sources and get a complete picture of their business.
- Flexible deployment options allow the platform to be deployed on-premises, in the cloud, or hybrid.
- Their extensible platform can handle large-scale data analysis
- Low TCO as the platform is easy to use and does not require a lot of training
- Security and governance ensures that data is secure and compliant
Pricing

Zoho Analytics has 4 pricing plans, which are billed as follows:
- Basic: $24 /month billed yearly
- Standard: $48 /month billed yearly
- Premium: $115 /month billed yearly
- Enterprise: $455 /month billed yearly
Get started with Zoho.
2. Sisense.
Best for building and deploying analytics apps (Quote-based).
Adam’s Take
Sisense is a great business intelligence tool that simplifies complex data. It also integrates with several popular data sources, making it a good choice for businesses that want to get started in this industry – all without investing in new infrastructure.
Best For
Simplifying Data
Price
Quote Based
Annual Discount
Annual Discount:
Promotion
Sisense is a Business Intelligence Software & Analytics platform that helps you simplify complex data and create analytic apps.
The API-first cloud technology also lets you embed the analytics apps anywhere you want.
It offers a self-service analytics platform that uses data from all touchpoints and numerous sources like Adwords, Google Analytics, and Salesforce.
Plus, it enables you to create enterprise-grade analytics apps on-premises or on the cloud with the lowest TCO (total cost of ownership).
Additionally, it uses in-chip technology for parallel processing and an in-memory columnar database to serve multiple servers while working on a single server.
This function helps you save on additional servers or hardware.
Integration with R functions in formulas also comes in handy for predictive analytics and advanced BI reporting.
Sisense Pulse is another unique feature. It leverages machine learning (ML) to identify and inform any data anomalies automatically.
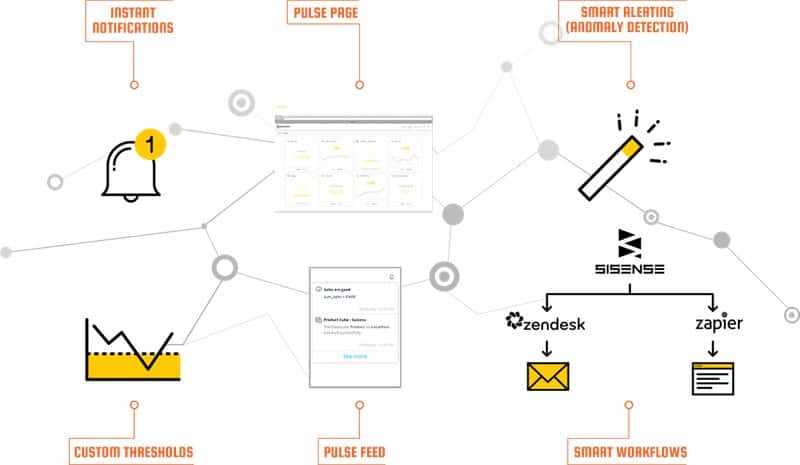
To give you an overview, Sisense provides all features to build analytic apps, including:
- Embed – to embed analytics anywhere you want with customizations and white labeling.
- Mashup – merge data models to optimize performance.
- Analyze – view and analyze visual and actionable data.
- Impact – Influence business decisions with business insights and answers to complex questions.
- Deploy – Deploy your analytic apps on-premises, on the cloud, or on the hybrid.
Key Features:
- Mashup – Merge data from multiple sources using its drag-and-drop feature to access actionable insights, even if you are a non-technical user.
- Cleanse – Identify and rectify data blunders without impacting its native source. It can help you secure dependable analytics with greater details.
- Interactive Dashboard – Keep your data ready with a few simple clicks. It enables you to explore, filter, and use data mining to help you find answers to complex problems.
Pros:
- Sisense can handle any amount of data.
- It offers hundreds of predesigned data visualization widgets.
- You can also submit your own open-source designs.
- It sends notifications directly to your smartphone, tablet, or a white label mobile app. It also provides access to the data on any mobile device.
- Combine private clouds, public clouds, and on-premises resources to develop a hybrid solution.
Pricing:

You can get a price quote based on your project type, number of users, data volume, project timeline, etc.
3. Tableau.
Best for data discovery and data visualization ($12 per user, per month).
Adam’s Take
Tableau needs no introduction. It is one of the most popular business intelligence tools available today. Organizations of all sizes use Tableau to make informed decisions and improve their overall performance.
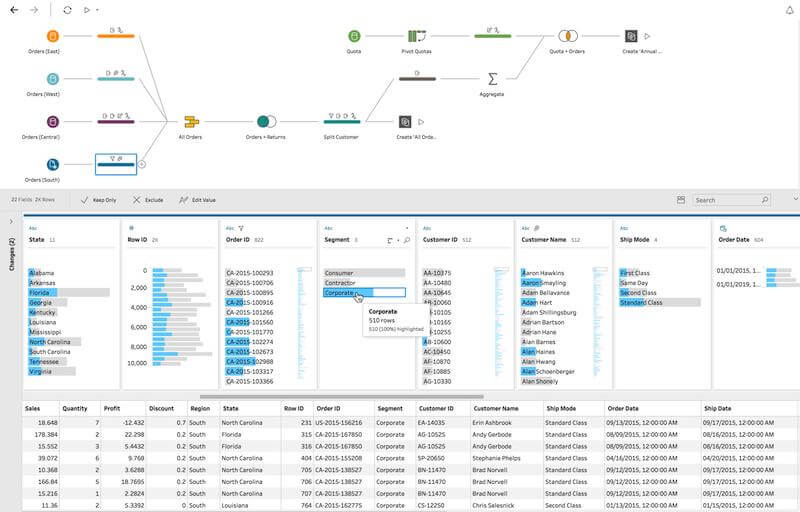
Tableau is a BI and Analytics software that helps you understand complex data and customize and embed data analytics with your products.
It offers a user-friendly, intuitive drag-and-drop user interface to help data scientists access and analyze data, make reports, and share insights across the organization.
The drag-and-drop feature also simplifies complex tasks, including pivoting and joining.
You can also re-order steps or edit values to watch results in real-time.
Besides, it leverages smart algorithms to collate redundant tasks like typo correction and brings them under a single click operation.
Plus, the Tableau Prep feature can help you clean, combine, and prepare data at a faster pace. It comprises of two tools – namely Tableau Prep Builder and Tableau Prep Conductor.
The Builder helps you build the data flow – while the Conductor helps with scheduling, scalability, monitoring, and managing the flow across the organization.
Key Features:
- Device Designer – It helps you customize, design, and publish optimized dashboards for tablet, desktop, and smartphone.
- Live Charts – Explore and understand data in real-time through live charts that offer data-rich visual patterns.
- Tableau Maps – It automatically turns the location data into interactive maps with 16 levels of zoom. You can also use custom geocodes to map the data as required.
- Tableau Blueprint – It helps you create a methodology to create a data-driven organization. From analytics strategy to deployment and maintenance & support, you can set the entire plan before implementing it.
Pros:
- It supports numerous third-party sources like MS Excel, Oracle, MS SQL, Google Analytics, etc.
- Create live stories to develop a compelling narrative.
- Easily share data and reports securely through Tableau Online or Tableau Server.
- Combine database and computer graphics to study large datasets on your laptop.
- It offers interactive visualization to explore hidden opportunities.
- The Ask Data feature leverages smart algorithms to index, profile, and optimize data sources.
Pricing:

Tableau offers different pricing plans for different deployment options.
On-premises or Public cloud:
- Tableau Creator: $70 per user, per month
- Tableau Explorer: $35 per user, per month
- Tableau Viewer: $12 per user, per month
Fully hosted by Tableau:
- Tableau Creator: $70 per user, per month
- Tableau Explorer: $42 per user, per month
- Tableau Viewer: $15 per user, per month
If you’re an individual, you can buy Tableau at $70 per month. Other add-ons include Tableau Data Management ($5.50 per user, per month) and Server Management ($3 per user, per month).
4. SAP Business Intelligence.
Best for analytics reporting and cross-enterprise sharing (Quote-based).
Adam’s Take
SAP Business Intelligence is another great tool that I advise you to check out if you are looking for a great business intelligence solution. With various data analysis and reporting features, this tool will surely help you make better business decisions.
SAP Business Intelligence offers a full business intelligence suite to help you with data visualization, data analysis, and reporting.
It can help you reduce guesswork by monitoring key metrics and providing access to actionable information.
The cloud-based analytics solution uses technologies, including in-memory computing and machine learning, to help you answer complex problems in just a few clicks.
The cross-enterprise sharing option helps you share data and reports in real-time. What’s more, integration with Office helps you manipulate and filter data and identify different trends.
It also lets you carry out large-scale data analytics and embed data into Microsoft PowerPoint presentations.

The scalable BI tool also offers self-service access to in-context and personalized insights on any device. Plus, it lets you create reports in any format by fast-tracking report design and adding graphics and videos.
Key Features:
- SAP Analytics Cloud – It offers access to all the database solutions and joins multiple analytical instruments at a single place.
- Predictive Analytics – It leverages machine learning to predict future trends based on your data. It also comes equipped with pre-built algorithms and ML model management tools.
- BusinessObjects BI Suite – It offers real-time data access with multiple capabilities, including reporting, interactive dashboards, ad hoc (instant) reports, and data visualization.
Pros:
- Available both on-premise and in the cloud.
- It also supports multilingual reports.
- It offers augmented analytics to help you understand complex data easily.
- Embed analytics with business applications.
- Color-based analytics solution for better understanding.
- Centralized location for all insights and reporting data with custom dashboards.
- Integration with MS Office.
- Free demo and customized pricing.
Pricing:
SAP provides quote-based pricing information.
You’d have to fill a form with details like the number of employees, company name, etc., to extract personalized pricing details.
5. Looker.
Best for startups and mid-sized businesses (Quote-based).
Adam’s Take
Looker is excellent for those businesses that need real-time analytics and also want to be able to share their data with clients or other companies. With various features that help make the right decisions, businesses can be confident in the intelligence provided.
Looker is a Business Intelligence tool that helps you analyze and share real-time analytics. It combines all the data and provides a broader overview.
Plus, it gives a 360-degree view of your business and customers and helps you drill down and invest appropriately.
Its dashboard tracks data and reports more deeply, at the same time, enhancing the existing tools by incorporating new data.
It also offers efficient collaboration to equip teams with more informed and data-driven decisions easily.
This way, you can identify up-sell opportunities, create tailored messages, and understand successful customers’ usage patterns successful customers to enhance business efficiency.
It also enables employees to track customers across various touchpoints and drive personalized interactions.
Looker also connects you directly to row-level data to help you find more intricate details and understand what’s happening precisely.
The tool also provides alerts regarding issues like fraudulent orders, so you can avert the problem before it becomes a roadblock.
Additionally, integrations with tools like Slack, Dropbox, Marketo, and Segment help you share data and initiate workflows.
Key Features:
- Looker Blocks – These are pre-built pieces of code that you can use to fast-track your analytics. It offers SQL patterns, custom visualizations, fully built-out data models, weather and demographic data, and more.
- Embedded Analytics – Embed analytics anywhere instantly while achieving the desired customization. It also offers plug-and-play solutions.
- Sales Analytics – Combine data from multiple systems to gain actionable insights to maximize sales and reduce churn.
Pros:
- It offers customizable and purpose-built business workflows for managers, representatives, and operational teams.
- Over 100 pre-built LookML modeling patterns to facilitate development.
- It allows you to choose the cloud and database architecture of your choice.
- Create custom-built applications based on your requirement.
- Looker’s SQL Runner helps you analyze data quickly and send easy-to-understand reports to non-technical end users.
Pricing:
Looker provides quote-based plans based on your company and the number of employees it has. You get features like internal embedding, live chat support, API access, and more.
6. MicroStrategy.
Best for large enterprises with big budgets.
Adam’s Take
MicroStrategy is great at data visualization and supports various data sources. Different assets provide users with a 360-degree view of their business, allowing them to make better decisions.
MicroStrategy is an enterprise-level BI tool that provides access to all enterprise data assets and performs data visualization.
Other prominent features include a self-service dashboard, location-based analytics, etc.
All these functions eliminate the need for any IT infrastructure to conduct data analyses and reporting.
You don’t have to write any complicated code, either.
You can also leverage its different deployment options – that is, you can either host it both on the cloud or on-site.
Plus, MicroStrategy promises to deploy a cloud platform within 48 hours.
It also lets you transfer the data from any source, including cloud, relational database, enterprise applications, Hadoop, and big data.
Key Features:
- Location-Based Analytics – To put the data into perspective, it puts relevant data into their geographies to make it more relatable.
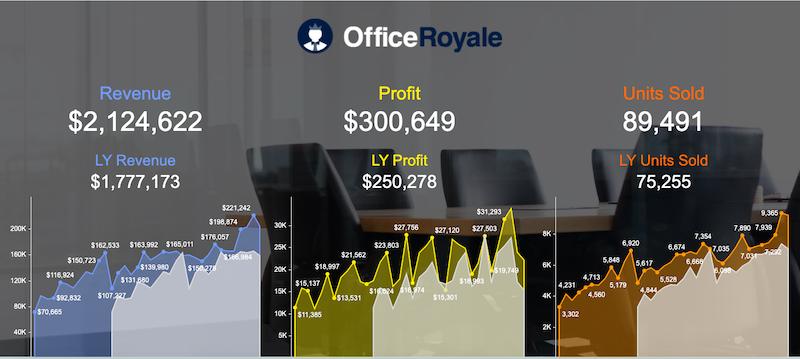
- Data Visualization – It offers color-rich interactive reports to help you understand complex data easily.
- Self-Service Dashboard – It helps you track key metrics of the business, including revenue, profit, sales, and more, from one location.
Pros:
- You can use the drag-and-drop function to insert built-in widgets.
- Save templates in the middle of the work and resume from where you left.
- Create sales and digital marketing reports quickly through the drag-and-drop feature.
- It offers multiple filters to help you create and view specific reports instantly.
- Eliminates the Excel work in the majority of the cases.
- It provides integration with voice search technology like Alexa.
Pricing:
There’s no mention of pricing plans on the official site. However, FinancesOnline suggests that MicroStrategy offers four pricing plans.
- Web Package: $600/named user or $300K/ CPU core
- Mobile Package: $600/named user or $ 300K/ CPU core
- Architect Package: $5,000/ named user
- Server Package: $1,200/named user or $ 600K/CPU core
7. Microsoft Power BI.
Best for collaborating with other Microsoft platforms like Office 365, Dynamics 365, Azure ($9.99 per month).
Power BI is a web-based BI tool that helps you find and share actionable insights using data visualization. It also provides built-in AI tools, Excel integration, and custom data connectors.
Plus, it lets you create and share reports personalized with your branding and KPIs.
The AI-powered algorithm is also capable of answering queries and works with the conversational language.
Power BI also offers data security across dashboards, reports, and data sets.
Its persistent security solutions continue to work even when the data gets shared outside the system or exported to PDF, Excel, or PowerPoint files.
Additionally, it offers a library of over 120 free connectors to provide access to everyone onboard.
You can also connect it directly to hundreds of on-premise and cloud data sources, including Azure SQL Database, Dynamics 365, Excel, Salesforce, SharePoint, etc.
Integration with Azure lets you analyze even petabytes of data. It also comes with advanced AI functions, additional data protection, and the ability to share insights across your organization easily.
If you want to learn more about Power BI and how it stacks up against one of its direct competitors, check out this review article on Power BI vs. Tableau.
Key Features:
- Power Pivot – It helps you import and integrate different datasets from multiple sources and create in-memory data models.
- Customized Visualization – Leverage its custom library to design data visualizations that meet your business requirements.
- Power Query – It enables data shaping and cleansing easily. You can rename the column, merge data, replace values, and modify other business-critical aspects of the data.
Pros:
- Its Power view feature supports maps with zoom and pan functionalities.
- It provides support for five programming languages, including DAX, Power Query, SQL, R, and Python.
- Power BI comes with an interactive Power BI desktop tool that is free to download.
- It displays a personalized view of the dashboard for different users based on their requirements.
- Ad-hoc data visualization and reporting.
Pricing:
Microsoft Power BI offers two pricing plans:
- Power BI Pro: $9.99 per month
- Power BI Premium: $4995 per month
The Premium plan is suitable for large organizations and provides features like cloud and on-premises reporting, advanced administration and deployment controls, etc.
8. Domo.
Best for extensive connectivity using data connectors (Quote-based).
Domo is a cloud-based BI tool that helps you turn raw data into actionable data and business-wide apps.
It offers customizable business solutions based on different organizational roles like finance, CEO, marketing, IT, sales, etc.
Besides, it provides multiple data connectors for Twitter, Google Sheets, Facebook, Zendesk, Excel, Salesforce, and more.
The self-service BI platform can handle the organization-wide data and provides a drag-and-drop interface to help non-technical users.
You can also connect to any data source – in the cloud, on-premise, or a hybrid between on-premise and cloud.
Plus, you can integrate Domo into the existing database of the business.
Additionally, built-in ETL tools and data pipelines help you visualize your data flows and process and load data into Domo.

Key Features:
- Report Scheduler – Schedule specific reports to teams and professionals at a particular time and date.
- Alert Center with – It works as a hub for notifications to metrics data and conversations to helps users take immediate action. You can also get alerts regarding KPIs.
- Domo Appstore – It provides numerous pre-built apps and connector APIs to let you build your own custom apps.
Pros:
- Domo provides mobile access to your data anytime, anywhere.
- Its query engine enables you to find answers quickly.
- Create customized data collections and dashboards.
- Leverage the ‘Task feature’ to manage workflows.
- Its text bots provide answers to questions in natural languages.
- Load heaps of data through a single click.
- Upload large data sets or import from ODBC, XML, Excel, and more.
Pricing:

Domo provides custom-based pricing. You have to contact their Sales team for a personalized quote. Besides, there’s a free trial initially.
9. Oracle Analytics.
Best for large enterprises looking for advanced AI and ML capabilities (Quote-based).

Oracle Analytics is a BI tool that helps with data management, integration, alerting, analyzing, reporting, and more.
Plus, it helps you analyze business intelligence insights through augmented analytics capabilities.
The Business Intelligence tool leverages embedded artificial intelligence (AI) and machine learning (ML) to analyze data and offer predictions for decision making.
You also get access to data-driven financial insights using predictive modeling and what-if scenario analysis.
Oracle’s self-service dashboard also lets you leverage organization-wide data, collaborate, and discover insights from all over the world.
The business analytics software offers four sub-products, including:
- Oracle Analytics Cloud – It helps you discover insights from anywhere you want, even using mobile devices. You can also use augmented analytics to combine data in your organization with third-party apps. This further helps you automate tasks like data preparation, visualization, forecasting, and reporting.
- Oracle Analytics Server – It helps you with on-premises or customer-managed deployment and discover more unique insights from raw data.
- Oracle Fusion Analytics – It provides access to best packaged KPIs and unified company data. Plus, Oracle Fusion helps you identify the precise value of your data with prebuilt integration and data models.
- Oracle Essbase – It lets you test and model business assumptions – whether on-premises or in the cloud.
Key Features:
- Augmented Analytics – It delivers AI-powered augmented analytics for smarter data preparation and discovering more accurate results. It also leverages natural language processing (NLP) to enable conversational-style answers and analytics.
- Mobile Exploration – It’s mobile-enabled and offers all the capabilities, including a fully functional dashboard.
- Data Connectors – You get numerous data connectors to connect to data sources in the cloud, on-premises, or on your desktop.
Pros:
- Easily share results and reports for seamless collaboration.
- It offers pre-built analytic data models in compliance with your security rules.
- Embed analysis within applications to enable interactions with customers through a chatbot.
- The ML models come with predictive analytics capabilities.
- Get an aggregated view of all the content and reports from a centralized dashboard.
Pricing:
The official site doesn’t have any pricing information.
You might have to contact the vendor for a custom pricing quote. A free trial is available.
10. Qlik.
Best for data exploration and visualization using visual dashboards ($30 per month).

Qlik is a BI and analytics tool that helps you develop analytics and provides you with dashboards multi-cloud data integration.
It offers a full BI suite that lets you deploy, design, and manage data without any coding know-how.
Qlik offers three significant functions:
- Data Integration – It provides data and analytics in real-time and performs data streaming, cataloging, refinement, etc.
- Data Analytics – It helps you turn raw data into actionable insights – on Qlik’s cloud or your own cloud.
- Data Literacy – Qlik’s team guides you and assists you in reading, working with, analyzing, and communicating with data.
Besides, Qlik’s sub-product QlikView provides data exploration and visually highlighted dashboards to understand data better.
Qlik also provides on-demand webinars to help you work with AI and analytics data. Not only this, but they also optimize your data pipeline.
Key Features:
- Qlik Replicate – Qlik helps organizations with data replication, injection, and data streaming.
- Data Warehouse – They automate the process of managing and optimizing data warehouse, generating ETL code, applying updates, etc.
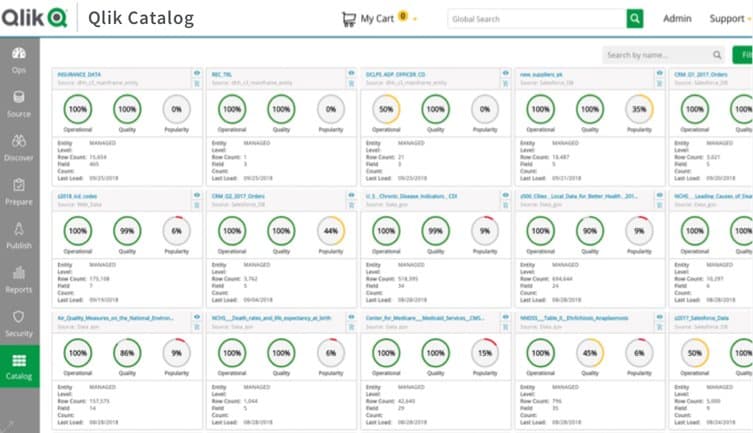
- Qlik Catalog – It puts all your data into a simplified view and helps you find data whenever you want. It also performs data standardization, cleansing, and implements protection measures.
Pros:
- API integration and end-to-end cloud data integration.
- Security and compliance certificate.
- It performs usage monitoring.
- Create custom analytics or import and embed analytics into your application.
- Qlik also provides personal consulting, training, and several support programs.
Pricing:
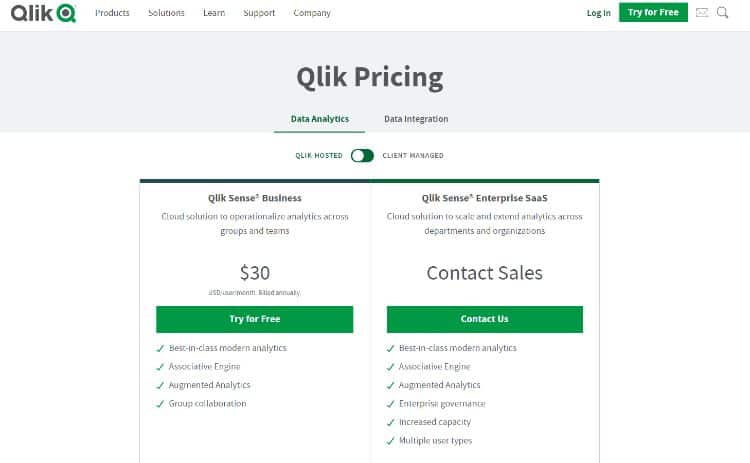
- Qlik Sense Business: $30 per user, per month
- Qlik Sense Enterprise SaaS: $70 per user, per month
Both the business plans include features like Augmented analytics, self-service creation, interactive dashboards, etc.
There are separate quote-based plans for data integration functions like data replication, warehouse automation, and cataloging.
11. IBM Cognos.
Best for creating and analyzing data reports ($15 per month).

IBM’s Cognos is an Ottawa-based AI-infused BI tool that helps you with data preparation, analysis, and reporting.
It enables you to process data discovery and view it using visual reports, facilitating better understanding and decision making.
The mobile app lets you access and monitors all stats and your dashboard anywhere at any time.
You also get alert notifications on your mobile phone every time something urgent comes up that needs your attention.
Plus, Cognos lets you monitor all your data with interactive graphs, charts, and tables.
It also automates data exploration and prepares, analyzes, and derives insights in the form of reports.
You can even add a new column, hide columns, reorder, perform calculations, split, and more.
Key Features:
- Predict the Future – IBM Cognos leverages AI to predict your future stats and forecast seasonal and time-based trends.
- Create Reports – It lets you create multi-page and multi-query reports for multiple databases.
- Share Insights – You can connect your dashboard to Slack or email and share data modules, widgets, and even your entire dashboard.
Pros:
- It helps you create visual reports and animated stories.
- Get real-time updates on your mobile phone.
- Import data from spreadsheets, CSV files, cloud, and more.
- It provides an extensive Q&A set to help you out if you face any problems with features like smart data discovery and natural language.
- You get automated version updates.
- It performs predictive analysis and seasonal forecasting.
- Cognos also provides control access based on roles.
Pricing:
Initially, you get a 30-days free trial. After that, Cognos offers three pricing plans:
- Standard: $15 per user, per month
- Plus: $35 per user, per month
- Premium: $70 per user, per month
- Enterprise: Quote-based plan
All the plans provide standard features like dashboards, animated stories, data sources, let you explore data in plain language, etc.
12. Dundas BI.
Best for mid-to-large enterprises for personalized reporting and data analysis (Quote-based).
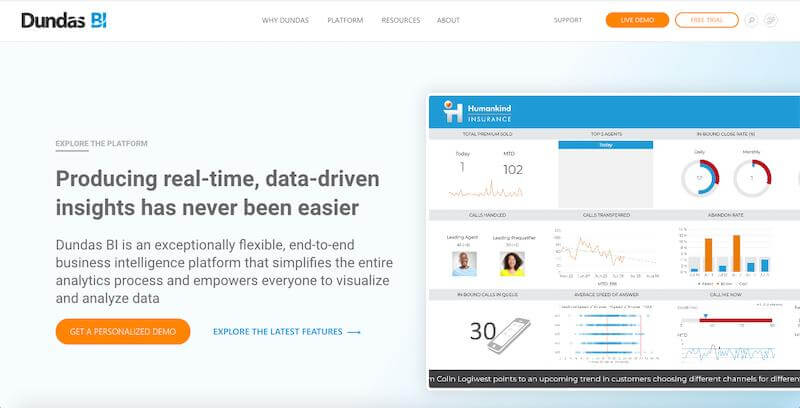
Dundas is another BI tool that produces real-time, data-driven insights and prepares, analyzes, and visualizes data.
You get all the insights in the form of dashboards, reports, and visual data analytics.
Basically, Dundas BI lets you utilize data by creating insights that eventually help you make data-driven and fact-based decisions.
They also provide personal consulting and training to assist you throughout the process.
Besides, the BI tool consolidates and store data from various sources and removes useless and repeated data in the process.
You can import or connect your data from numerous sources like relational databases, web-based data, ODBC/JDBC, file-based data, OLAP, etc.

Plus, Dundas BI is built with HTML5 and fully open APIs – which helps you customize and enhance the platform on your own.
You can customize dashboards, labels, scoreboards, designs, etc., to meet your precise design requirements.
Some of its new features include:
- New functions to zoom your charts.
- Connect directly to Microsoft Azure Table storage or Azure Cosmos DB tables.
- Restrict access and allow login from only specific IP addresses.
- Automatically size text.
- Install Dundas BI on Linux.
Key Features:
- Slideshows – Slideshows allow you to define your own selection of dashboards or other news in sequence.
- Charts – Dundas BI helps you create charts such as column/bar, pie chart, curved line, bar chart, etc., for data visualization.
- Mobile Experience – You can build, view, and share dashboards, data reports, and scorecards on your mobile device anywhere and at any time.
Pros:
- You can use sample data and Excel data.
- Integrate with all types of data sources.
- You can visualize data through heatmaps.
- Drag-and-drop tools for easy customization of reports.
- It also provides a live demo and a free trial.
Pricing:

Quote-based plans.
What Are BI (Business Intelligence) Tools?
BI (Business Intelligence) Software helps you analyze business data critically and churn out actionable insights.
It also helps businesses identify their strengths and weaknesses using data forecasting and existing trends.
Additionally, BI tools help the management visualize the relation among different data sets, make data-driven decisions, and deploy resources more optimally.
Besides, a capable BI software collates data from all the relevant touchpoints, processes it, and churns out relevant reports and actionable data. It identifies and represents all the complex data in an easy to understand manner.
You can also leverage BI tools to create specific reports and send them to different stakeholders.
On top of that, advanced BI software uses big data and cloud-computing capabilities to simplify complex data analysis further.
In a world where unstructured data makes up as much as 90% of information online, having organized business data is key.
Additionally, it enables organizations to integrate business intelligence practices across teams.
You can deploy and integrate modern BI solutions with legacy systems.
How Are BI Tools Different From Data Analytics Tools?
Business Intelligence (BI) is a broad term that covers data analytics and other reporting features. It helps in making decisions using historical data.
Thus, BI tools come equipped with cutting-edge technologies that reduce the complexities related to business intelligence and prepare, analyze, report and share data with multiple sources.
On the other hand, Data Analytics focuses more on algorithms to identify the core relationship between multiple data sets.
One of the significant differences between BI and Analytics tools is that analytics also offers predictive capabilities.
However, BI just helps in making informed decisions based on past data analytics.
Which Features Do You Need in BI Tools?
Here are a few essential features that you need to look for in a BI tool:
- Ranking Reports – This feature can help you identify what is working and what is not working for your business. You can also analyze the ranking through various dimensions and focus only on specific areas.
- Executive Dashboards – Leverage intuitive dashboards to gain a real-time overview of your organization. You can study business-critical data sets through charts, summaries, graphs, and other customized reports.
- Interactive Reports – It will help you condense and analyze heaps of data in an easy to understand format. You can use these reports to identify anomalies, outliers, and trends in the historical data.
- Geospatial Mapping – Location intelligence can help in transforming your data into a cartographical and graphical representation. Plus, simplified data laid out on the map will help non-technical people understand it easily.
- Operational Reports – It can help track and analyze daily events and make data-driven decisions.
- Open Integration – Your BI tool should be able to fetch data from numerous sources like emails, websites, social media platforms, and more.
How Do You Use a BI Tool?
While all the BI tools have varied features and functioning, the overall working is nearly similar.
I am using Microsoft Power BI to demonstrate how the basic functionalities of a BI software works.
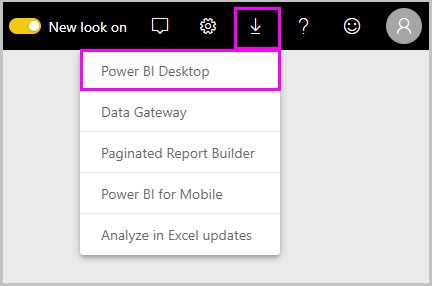
Step #1. Download and Install.
Go to Power BI service to download Power BI Desktop. Click on the Download icon and click on the ‘Power BI Desktop’ option.
On the welcome screen, you’ll see three main options:
- Get Data
- Recent sources
- Open other reports
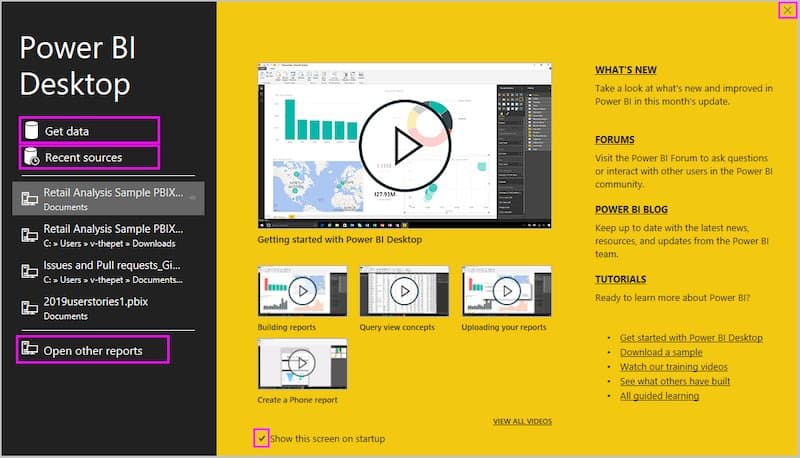
You’ll also see options for three different Power BI desktop views on the left side of the desktop – namely, Report, Data, and Relationships.
The ‘Report view’ option is the default view of Power BI.
Note that its Power Query Editor opens in a separate window.
Step #2. Connect the Data.
To connect Power BI to different data sources, go to Get Data > More to select from various options.
Or to connect Power BI to the web data source, go to Get Data > Web.

Now just paste the URL of the website you want to extract data from and click on the ‘OK’ option.

You can now load the data Tables or make changes to the table before loading it.
After you select Transform data, Power Query Editor will get launched.
Step #3. Shape Data.
If you want to change the data type, select columns that you want to change.
Now hold the ‘Shift Key’ to select multiple adjacent columns or ‘Ctrl’ to select non-adjacent columns. Select the new data type through the drop-down list located right next to Data Type in the Transform group.

For a more detailed approach, you can follow this guide to get started with Microsoft Power BI.
Hope these steps will help you understand the basic functionality of a BI tool, namely the Microsoft Power BI.
Making Use Of Business Intelligence Reporting Tools.
Many business users use multiple data sources on their business intelligence platform of choice to make better decisions.
This data may come from a variety of internal sources such as enterprise resource planning (ERP) applications, customer relationship management (CRM) applications, financial applications, and others.
It may also come from external sources such as market research reports, news articles, and demographic data.
The right reporting tools allow data analysts to use online analytical processing to improve business performance and provide actionable business insights to decision-makers.
The right data analytics platform should feature the right reporting tools as well as the ability to connect to various data sources.
Executive Summary.
Those were my picks for the best BI tools to try this year.
With the big data analytics market likely to reach $103 billion by 2023, it’s important to start harnessing the power of cloud data and advanced analytics.
The good news is that all of these BI tools offer easy-to-install business intelligence capabilities, including data augmentation, reporting, visualization, and more.
However, each tool comes with its own unique selling points.
For instance, Domo and Microsoft Power BI are best for large enterprises requiring intricate reporting capabilities. On the other hand, Looker is a suitable BI tool to track customer actions and enhance sales for ecommerce businesses.
Overall, my top pick is Sisense because of its ease of use, ability to handle almost any amount of data, and its ability to build and deploy tailored analytics apps.
Nevertheless, make sure to go through key features, pros, and cons to make your final decision.
Which BI tool works for your business and why? Let me know in the comments below.
Further reading on AdamEnfroy.com: Check out this list of big data tools for better analytics in your business.